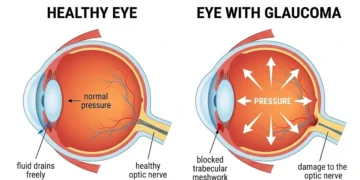
Glaucoma Takes Your Sight Without Telling You, And Your Own Brain Helps It Hide
You trust your eyes to complain when something is wrong. Something gets in, they water. Too bright, you squint. That...
Read moreDetails

The global market for human growth hormone injections reached between $6.8 and $7.65 billion in 2024, depending on which research firm you ask. By 2025, that figure climbs to approximately $8.6 billion, marking a consistent 10-12% year-over-year growth. But here’s what matters more: five countries control nearly 90% of this entire market.
This isn’t just about dollars. It’s about where pharmaceutical-grade HGH actually gets manufactured, who produces it, and how a handful of nations have built an oligopoly in recombinant human growth hormone production.
Before diving into manufacturing dominance, we need to address the elephant in the room: no single universally agreed-upon market size exists for HGH.
2024 Market Size Estimates:
| Research Firm | 2024 Revenue (USD Bn) | 2025 Revenue (USD Bn) | YoY Growth % |
|---|---|---|---|
| Straits Research | 6.81 | 7.63 | 12.0 |
| Research and Markets | 4.75 | 5.23 | 10.1 |
| SkyQuest | 7.10 | 7.97 | 12.4 |
| SNS Insider | 7.15 | 8.05* | 12.5 |
| Nova One Advisor | 7.65 | 8.60 | 12.4 |
*Projected based on stated CAGR
The variance stems from different methodologies—some firms focus on prescription markets, others include clinical trials, and definitions of “pharmaceutical-grade” vary. For this analysis, we’re using Nova One Advisor’s conservative baseline of $7.65 billion for 2024.
What doesn’t vary? The growth drivers. Rising diagnoses of growth hormone deficiency, expanded pediatric applications, adult treatment protocols, and breakthrough long-acting formulations all push demand upward at double-digit rates.
Production data by country doesn’t exist in public records because HGH manufacturing is company-led, not state-owned. But market share, manufacturing facilities, and revenue proxies reveal a clear hierarchy.
Market Share: $3.21 billion (42% of global market)
Manufacturing Sites: 8-10 FDA-approved facilities
Key Players: Pfizer (Genotropin), Eli Lilly (Humatrope), Genentech
The United States doesn’t just lead—it dominates. With facilities spanning Michigan, New Jersey, and the San Francisco Bay Area, American pharmaceutical giants produce nearly half of the world’s pharmaceutical-grade HGH injections.
Pfizer’s Genotropin alone generated $480 million in 2024 revenue. While that’s a fraction of Pfizer’s $62.2 billion total revenue (0.77%), it represents substantial market control. Eli Lilly’s Humatrope contributes less than $100 million, overshadowed by their blockbuster diabetes drugs, but maintains steady production.
Why does the US dominate? Three factors: aggressive R&D investment, robust insurance reimbursement infrastructure, and FDA regulatory excellence that other markets struggle to match. American facilities set global manufacturing standards.
Market Share: 15-20% (approximately $1.5-2.0 billion)
Manufacturing Sites: 3-4 major production facilities
Key Player: Novo Nordisk (Norditropin, Sogroya)
Denmark punches far above its weight, and it’s entirely because of one company: Novo Nordisk. Their Kalundborg facility is among the world’s largest biologics manufacturing complexes, producing Norditropin at scale.
Novo Nordisk’s rare endocrine disorder segment—primarily growth hormone products—generated approximately DKK 10-15 billion (roughly $1.5-2.2 billion USD) in 2024 from US operations alone. Total Norditropin sales globally likely approach $2.5 billion, with 16-24% sales growth projected for 2025.
The Danish giant isn’t resting. A $4.1 billion capacity expansion in the United States signals aggressive plans to capture even more market share, particularly with their long-acting weekly formulation Sogroya gaining traction.
Market Share: 10-12% (approximately $800 million – $1 billion)
Manufacturing Sites: 2-3 GMP-certified facilities
Key Player: Sandoz/Novartis (Omnitrope)
Switzerland’s contribution centers on Sandoz’s Omnitrope, the pioneering biosimilar that cracked open the HGH market to lower-cost alternatives. With facilities in Kundl, Austria and Swiss sites, Sandoz leverages European pharmaceutical excellence.
While Sandoz doesn’t break out Omnitrope revenue separately, the biosimilar segment drove double-digit growth within their $10.4 billion total 2024 sales. Estimated HGH revenue sits between $300-500 million, with constant currency growth of 9% in 2024.
Omnitrope captured 15.7% of the US market and commands even stronger shares in Europe, where biosimilar adoption runs ahead of American markets. Swiss precision manufacturing meets cost-conscious healthcare systems.
Market Share: 8-10% (approximately $650-800 million)
Manufacturing Sites: 6-8 major production facilities
Key Players: AnkeBio (Ansomone), GeneScience Pharmaceuticals (Jintropin)
China represents the wild card in HGH manufacturing. Domestic producers like Anhui Anke Biotechnology (AnkeBio) and GeneScience Pharmaceuticals have built formidable production capacity, with facilities in Anhui Province and Changchun.
AnkeBio reported $220 million in HGH-specific revenue for 2024—modest by Western standards but growing rapidly. Combined Chinese production likely supports $500-700 million in market value, focused primarily on domestic consumption but with expanding exports to Southeast Asia and emerging markets.
The Asia-Pacific region shows the fastest growth at 23.4% CAGR, and China sits at the epicenter. Government support for biotechnology, cost-competitive manufacturing, and a massive domestic market position China to potentially overtake Switzerland and Israel within three years.
Market Share: 5-7% (approximately $400-550 million)
Manufacturing Sites: 1-2 facilities
Key Player: Teva Pharmaceutical
Israel’s contribution comes through Teva Pharmaceutical’s generic and biosimilar programs. With facilities in Jerusalem and Rehovot, Teva focuses on high-volume, affordable production for global distribution.
Here’s the catch: Teva doesn’t disclose HGH-specific revenue within its $16.5 billion total 2024 sales. The contribution is negligible compared to their neurology and generic medicine portfolios, but Israel maintains a foothold in HGH manufacturing through cost-efficient production targeting emerging markets.
Where HGH gets produced doesn’t perfectly align with where it’s consumed. Regional market distribution tells a different story:
2024 Regional Market Breakdown:
| Region | Market Share | Value (USD Bn) | Key Characteristics |
|---|---|---|---|
| North America | 42% | $3.21 | US represents 92% of regional market; strong reimbursement |
| Europe | 28% | $2.14 | Germany/UK/France lead; biosimilar adoption accelerating |
| Asia-Pacific | 18% | $1.38 | Fastest growth (14% CAGR); diagnostics infrastructure expanding |
| Latin America | 7% | $0.54 | Emerging access; Brazil driving infrastructure gains |
| Middle East & Africa | 5% | $0.38 | Limited penetration; GCC and South Africa showing promise |
North America consumes 42% despite representing a fraction of global population. Why? Insurance coverage, established diagnostic protocols, and higher per-capita healthcare spending. A US patient might pay $30,000-50,000 annually for HGH therapy—prices unthinkable in most markets.
Asia-Pacific shows where growth happens. China and India are building diagnostic infrastructure, training endocrinologists, and expanding access. By 2030, Asia-Pacific could challenge North America’s revenue dominance.
Manufacturing countries matter, but specific hgh injection brands tell us who controls prescriptions:
Global Brand Market Share (2024 Estimates):
| Rank | Brand (Company) | Market Share | Notes |
|---|---|---|---|
| 1 | Norditropin (Novo Nordisk) | 28-30% | Global leader; 30% in growth hormone deficiency market |
| 2 | Saizen (Merck) | 20-25% | US leader at 31.1%; strong European presence |
| 3 | Omnitrope (Sandoz) | 15-18% | Biosimilar pioneer; US 15.7% share |
| 4 | Humatrope (Eli Lilly) | 10-15% | US 29%; declining originator facing biosimilar pressure |
| 5 | Genotropin (Pfizer) | 8-12% | US 7.8%; global approximately 10% |
| 6 | Ansomone (AnkeBio) | 2-5% | China-focused; emerging export presence |
Norditropin’s dominance reflects Novo Nordisk’s decades of investment in endocrinology. Saizen leads in the US but varies globally. Omnitrope represents the biosimilar success story—15.7% US share proves physicians and patients will adopt lower-cost alternatives when quality matches.
Chinese brands like Ansomone remain niche globally but dominate Asia-Pacific markets where price sensitivity runs high.
Approximately 25-35 major GMP-certified (Good Manufacturing Practice) facilities worldwide produce pharmaceutical-grade recombinant human growth hormone. Here’s the breakdown:
Manufacturing Facilities by Country (2024-2025):
| Country | Facility Count | Key Sites/Companies |
|---|---|---|
| USA | 8-10 | Pfizer (Michigan/Kalamazoo), Genentech (SF Bay), Eli Lilly (Branchburg, NJ) |
| China | 6-8 | AnkeBio (Anhui), GeneScience (Changchun) |
| Denmark | 3-4 | Novo Nordisk (Kalundborg, multiple production lines) |
| Switzerland | 2-3 | Sandoz (Kundl Austria/Swiss sites), Merck (Zurich) |
| Israel | 1-2 | Teva (Jerusalem/Rehovot generics facilities) |
| Others | 5-10 | India (Lupin), South Korea (LG Chem), EU (Pfizer Strangnas, Sweden) |
Global production capacity estimates sit around 4-6 billion international units (IU) annually. Novo Nordisk likely commands 1-1.5 billion IU capacity, with Pfizer around 500 million IU and Sandoz between 400-600 million IU.
Supply constraints exist. Novo Nordisk has publicly reported limitations, driving their massive DKK 80+ billion investment program and $4.1 billion US expansion. When demand outpaces supply by even small margins, shortages ripple through global markets.
One of the most interesting dynamics in HGH manufacturing is the branded versus biosimilar divide:
Market Split by Region (2024):
| Region | Branded Share | Biosimilar Share | Notes |
|---|---|---|---|
| Global | 75-80% | 20-25% | Innovators maintain dominance via physician loyalty |
| USA | 80-85% | 15-20% | Omnitrope leads biosimilar segment at 15.7% |
| Europe | 65-70% | 30-35% | Early adopter; tender systems favor biosimilars |
| Asia | 85-90% | 10-15% | Branded preference despite generics availability |
By 2025, the split shifts to approximately 70% branded, 30% biosimilar globally. Europe leads adoption—22% of all biologics were biosimilars by 2023, with HGH following that trend. European tender systems and national health services actively push 30% cheaper biosimilar alternatives.
The United States lags despite Omnitrope’s success. Physician prescribing habits, patient brand loyalty, and insurance formulary complexity slow biosimilar adoption. But change accelerates—projections suggest biosimilars could capture 40% global share by 2030 as interchangeability regulations evolve.
Asia presents a paradox: Chinese manufacturers produce affordable HGH, yet branded products from Western companies maintain 85-90% share. Physician and patient trust in established brands outweighs cost considerations, at least for now.
Market projections through 2030 show aggressive expansion:
Growth Trajectory (2026-2030):
| Year | Market Value (USD Bn) | Key Drivers |
|---|---|---|
| 2026 | $8.95 | Long-acting formulations gain adoption |
| 2027 | $10.04 | Biosimilars expand access in emerging markets |
| 2028 | $11.27 | Adult growth hormone deficiency segment +13.7% CAGR |
| 2029 | $12.65 | Asia-Pacific diagnostic infrastructure surge |
| 2030 | $14.27 | Market nearly doubles from 2024 baseline |
That’s a compound annual growth rate of 12.3% from 2025-2030. Faster than most pharmaceutical segments.
Regional Growth Differentials:
Three factors drive this expansion:
1. Long-Acting Formulations
Weekly Hgh Injections (like Novo Nordisk’s Sogroya) versus daily shots improve patient compliance dramatically. Expect 20-30% of market to shift to long-acting by 2030.
2. Adult Growth Hormone Deficiency Recognition
For decades, HGH therapy focused on children. Adult GHD diagnosis and treatment now grows at 13.7% CAGR as awareness spreads and diagnostic criteria standardize.
3. Biosimilar Penetration
As patents expire and regulatory pathways clear, biosimilars could represent 40% of global market by 2030, expanding access in price-sensitive regions.
Drawing from trusted sources like WebMD and Mayo Clinic, HGH’s role in health is fascinating. For those with diagnosed deficiencies (from pituitary issues or aging), it might help:
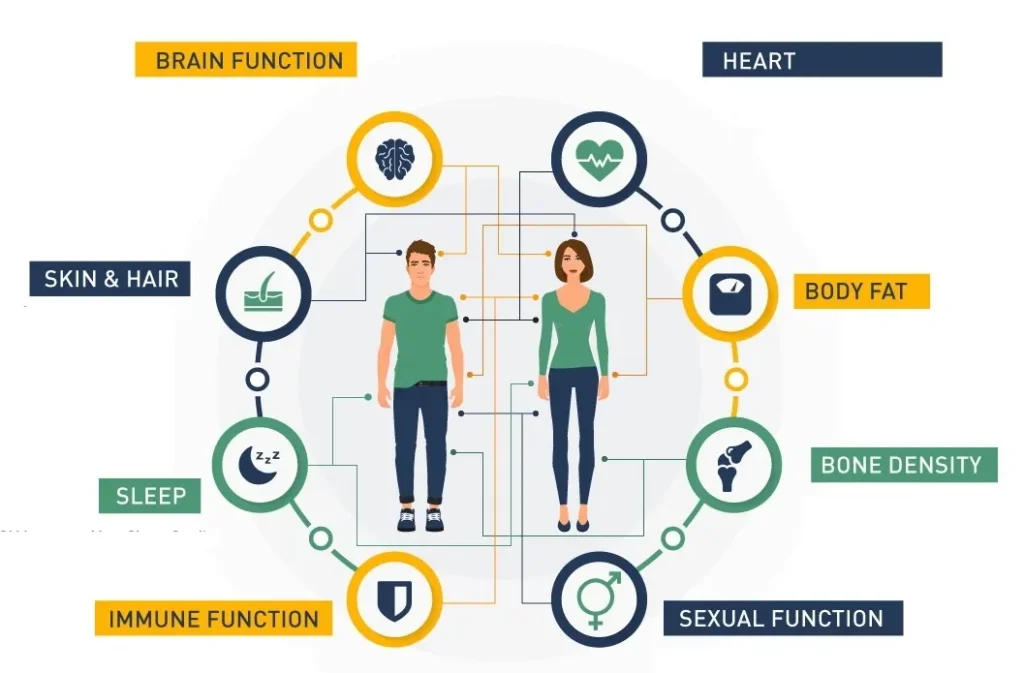
No health topic is complete without balance. HGH isn’t risk-free, especially if not pharma-grade or prescribed. Common side effects from sources like Healthline include:
Abuse for bodybuilding or anti-aging amps these up—think heart strain or hormone disruptions. Harvard Health warns against non-medical use, as it doesn’t reliably slow aging and can harm.
For safe online exploration: Stick to regulated sites. Get a prescription after tests—illegal without in many places like the US. Check local laws; EU rules vary by country.
Five countries controlling 85-90% of global HGH production creates both stability and vulnerability. The United States and Denmark aren’t going anywhere—their dominance reflects decades of investment, regulatory excellence, and market position.
China represents the variable. If Chinese manufacturers scale exports while maintaining quality standards, they could challenge Switzerland and Israel by 2028. China’s 23.4% Asia-Pacific CAGR provides the foundation for global expansion.
Biosimilar adoption will reshape revenue distribution. Sandoz proved the model works; other manufacturers will follow. Expect branded products to retreat to premium positioning while biosimilars capture volume in cost-conscious markets.
The HGH injections market sits at an inflection point: rapid growth meeting manufacturing concentration, biosimilar disruption challenging incumbent dominance, and emerging markets building infrastructure that could shift global consumption patterns.
From $7.65 billion in 2024 to a projected $14.27 billion by 2030, the growth hormone market expands aggressively. But the question isn’t just how big it gets—it’s whether the five-country oligopoly loosens or tightens its grip on production, pricing, and access.
Note: Market data compiled from Straits Research, Nova One Advisor, SkyQuest, Research and Markets, SNS Insider, Mordor Intelligence, and company financial reports. All figures represent 2024-2025 estimates unless otherwise specified. Regional and market share percentages are approximations based on available public data.

You trust your eyes to complain when something is wrong. Something gets in, they water. Too bright, you squint. That...
Read moreDetails
Copyright © 2024 NoodleMagazine - All Right Reserved