
Budgeting an Interstate Move: The Numbers to Sort Before the Boxes
Moving states costs most Australian households somewhere between $2,000 and $6,000 for the transport alone, before stamp duty, storage or any of...
Read moreDetails

Buying a stock without understanding the business behind it is not investing. It’s guessing with money. And guessing with money rarely ends well.
Stock analysis gives you a way to evaluate whether a company deserves your capital. Not based on headlines. Not based on what someone said on social media. Based on actual data, earnings, growth, price behaviour, and risk.
You don’t need a finance degree to do this. You need the right concepts and the patience to apply them. This article covers exactly that.
When people talk about stock analysis, they usually mean one of two things. Fundamental analysis looks at the business earnings, revenue, debt, and margins. Technical analysis looks at the stock price trends, patterns, volume, and momentum.
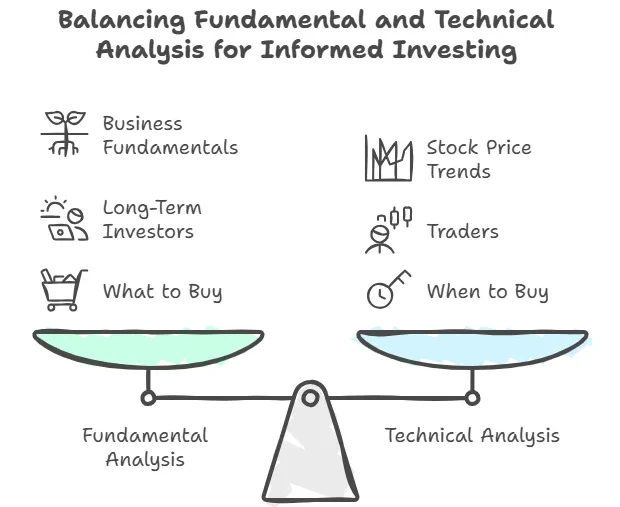
Most long-term investors lean towards fundamentals. Traders lean towards technicals. But the line between them is blurrier than textbooks suggest. A company might have perfect financials. But if the chart shows six months of steady selling on heavy volume, something’s off. The market may be telling us something that the balance sheet doesn’t say.
How? Fundamental analysis tells us what to buy, whereas technical analysis tells us when to buy. It is important for any investor to comprehend both in at least an elementary way.
This part intimidates beginners. It shouldn’t. You don’t need to read a 200-page annual report on day one. Four metrics give you enough to start filtering good opportunities from bad ones.
These four numbers won’t tell you everything. But they’ll tell you enough to avoid the worst mistakes before they cost real money. That’s stock analysis doing its job.
Charts aren’t just for traders. They’re a reality check for anyone putting money into a stock.
A stock might look perfect on paper. Strong margins, low debt, growing revenue. But pull up the chart and see a clear downtrend? The market is pricing in something the financial statements haven’t caught up with. Ignoring that signal is how beginners get trapped in positions that keep falling.
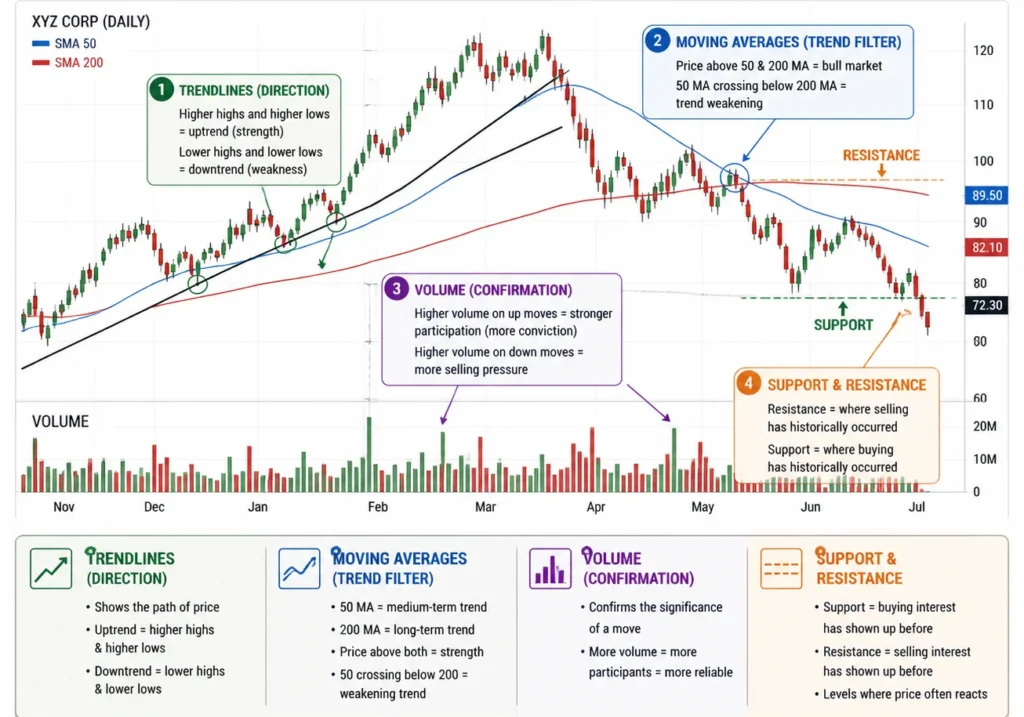
You don’t need thirty indicators cluttering the screen. Four concepts handle most of what matters in technical stock analysis. Trendlines show direction higher highs and higher lows mean strength, the opposite means trouble. Moving averages (particularly the 50 and 200) help us filter out the noise and focus on the underlying trend. The volume helps us determine the significance of a move and whether it has legs to last. Support and resistance levels show us where the buying and selling has traditionally occurred.
That’s your starter kit. Most professionals rely on some version of these same tools. They just add more nuance over time.
This is where beginners lose money they didn’t need to lose. They spot a great company exciting product, growing earnings, all the right buzz and buy without checking the price tag.
A strong business at an overpriced valuation is still a bad trade. At least in the short to medium term.
Stock analysis without a valuation step is half the job done. The P/E ratio helps, but it’s not enough on its own. The PEG ratio adjusts for growth expectations. A P/E of 35 looks steep until you see earnings growing at 40% annually. That changes the math.
Free cash flow deserves more attention than most beginners give it. It measures what a company actually generates after covering operations and reinvestment. Some businesses report healthy profits on paper but burn through cash quietly. Free cash flow catches that gap. If a company can’t convert earnings into real cash, those earnings become questionable.
The difference between a beginner who improves and one who stays stuck? It’s not talent. Not luck. It’s process.
Follow the same steps every time. Understand the business what does it do, how does it make money? Check the financials. Evaluate valuation. Read the chart. Then ask one more question that most beginners skip entirely. What could go wrong?
Every company carries risk. Competitive pressure, regulatory shifts, customer concentration, management changes. You can’t avoid risk completely. But you can understand it before committing your money. That awareness alone puts you ahead of most retail investors who buy first and think later.
The majority of beginner losses don’t come from bad stock analysis. They come from no stock analysis at all. Excitement replaces process. FOMO replaces discipline. And by the time reality sets in, the damage is already done.
Consistency compounds. Just like returns.

Moving states costs most Australian households somewhere between $2,000 and $6,000 for the transport alone, before stamp duty, storage or any of...
Read moreDetails
Copyright © 2024 NoodleMagazine - All Right Reserved